
Tip No. 1: Follow the Money
If you want to boost your company’s revenues from export sales, we have 7 tips for selling firearms, parts, scopes and other accessories to customers outside the United States.
Our first tip is: “follow the money.” In other words, identify the markets in which your products will sell best and focus your sales and marketing resources there.
1. Consider Starting with Canada
Most everyone in the industry who ventures outside U.S. borders goes to Canada first. There are lots of good reasons for that (we’ll cover a few others in future posts) but foremost is the fact that Canada is where you are likely to find the most sales opportunities.
How likely, you ask? Here’s a good gauge:
Table 1 – U.S. Exports of Firearm Products to Canada
|
|
2017 |
2016 |
2015 |
|
Sporting rifles |
$47,080,166 |
$41,221,550 |
$48,589,252 |
|
Handguns |
$22,562,709 |
$15,769,845 |
$20,264,606 |
|
Sporting shotguns |
$13,653,938 |
$14,753,850 |
$17,768,434 |
|
Riflescopes |
$18,798,423 |
$16,637,599 |
$18,539,475 |
|
Parts and accessories |
$31,298,888 |
$28,366,285 |
$9,935,565 |
|
ANNUAL TOTAL |
$133,394,124 |
$116,749,129 |
$135,097,332 |
Source: U.S. Census Bureau
Table 1 says that Canada is a big market for all types of U.S. firearm products. In fact, Canada is the number one international market for U.S. exporters in the firearms industry. That’s great, but it’s also not a secret, so there is competition, which is not so great.
That said, there are plenty of U.S. companies that export to Canada and nowhere else. It’s the best place to start if you’re new to exporting.
After Canada . . . . Where Next ?
Why stop at Canada once you have dipped your toe into the export waters? To maximize your company’s international sales potential, consider looking beyond Canada to other countries where opportunities exist and where it may be a little easier to stand out from the pack.
Which countries?
The best source for free data regarding which firearm products sell best in which countries is the U.S. Census Bureau. The Census Bureau receives data from exporters when products are shipped. Compilations of annual sales information for each “Schedule B number” are publicly available and easy to find on the Census Bureau website. NSSF also publishes compilations that are available to NSSF members.
We’ll save you some trouble and give you stats right here on the top 10 foreign markets, after Canada, for U.S. firearm products, based on available Census Bureau data. Countries have been color-coded to help you spot year-to-year trends.
Even with color-coding, the raw statistics can be difficult to digest, so here are some overall observations:
- The leading markets vary by type of product: sporting rifle, handgun, shotgun, riflescopes, parts and accessories. In other words, the best markets for one product category may not be the best for others.
- Census Bureau statistics distinguish between military and sporting rifles but the military/sporting distinction does not carry over to handguns, riflescopes or parts and accessories. The significance of this is that governmental purchases are uneven from one year to the next, creating anomalies (see, e.g., sales of riflescopes to Pakistan in 2015 and to Jordan in 2016 in Table 5 below).
- Wide swings in exports to a particular country from one year to the next are common.
- There are limited export opportunities for U.S. shotguns.
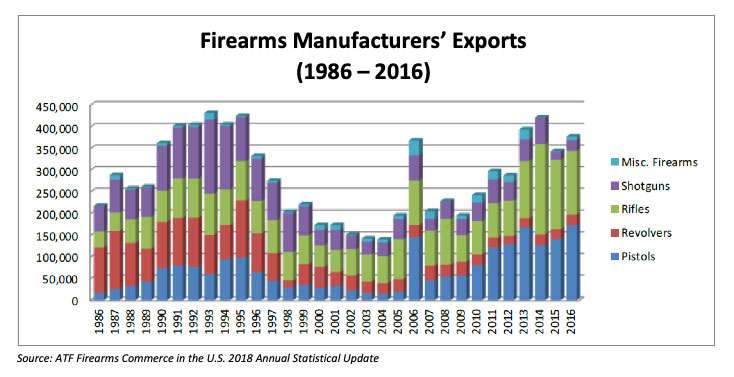
- Over the last 30 years, the export market for firearm products has been cyclical, but the most recent 15 years have been marked by steady overall growth, as illustrated in Table 7, which is derived from annual AFMER reports filed with ATF by U.S. manufacturers. If new export regulations for firearm products take effect as planned, it would be reasonable to expect the positive trend to continue.
These aren’t the only foreign markets to consider, of course, but they are the biggest ones for U.S. firearm products. If you sell into Canada today and see countries on these tables where you don’t already have a presence, they probably are the places to go next.
Top 10 Non-Canadian Markets for Firearms, Scopes, Parts and Accessories
Table 2 – Top 10 Foreign Destination Countries (after Canada) for U.S. Sporting Rifles
|
|
2017 |
|
2016 |
|
2015 |
|
Australia |
$9,151,266 |
Australia |
$8,625,292 |
Australia |
$11,450,773 |
|
France |
$6,847,089 |
Germany |
$6,028,620 |
France |
$3,474,098 |
|
Germany |
$6,007,858 |
France |
$5,376,993 |
Ukraine |
$3,432,924 |
|
New Zealand |
$2,986,534 |
South Africa |
$2,244,052 |
Germany |
$3,216,798 |
|
Belgium |
$2,310,615 |
Belgium |
$1,997,958 |
New Zealand |
$3,140,698 |
|
South Africa |
$2,235,062 |
Italy |
$1,864,301 |
South Africa |
$2,943,775 |
|
Italy |
$2,148,405 |
New Zealand |
$1,853,912 |
United Kingdom |
$2,698,981 |
|
Ukraine |
$2,132,296 |
Ukraine |
$1,714,923 |
Italy |
$1,928,996 |
|
United Kingdom |
$1,966,761 |
United Kingdom |
$1,459,311 |
Belgium |
$1,642,188 |
|
Switzerland |
$1,781,617 |
Switzerland |
$1,346,173 |
Thailand |
$1,421,774 |
|
ANNUAL TOTAL |
$37,567,503 |
ANNUAL TOTAL |
$32,511,535 |
ANNUAL TOTAL |
$35,351,005 |
Source: U.S. Census Bureau
Table 3 – Top 10 Foreign Destination Countries (after Canada) for U.S. Handguns
|
|
2017 |
|
2016 |
|
2015 |
|
Thailand |
$22,499,262 |
Peru |
$14,548,249 |
Thailand |
$9,979,743 |
|
Belgium |
$7,774,732 |
Belgium |
$9,672,881 |
Belgium |
$6,912,984 |
|
Philippines |
$6,130,231 |
Thailand |
$7,178,144 |
Saudi Arabia |
$5,638,252 |
|
United Arab Emirates |
$5,271,641 |
Israel |
$7,062,529 |
Israel |
$3,684,927 |
|
Paraguay |
$5,138,721 |
France |
$4,148,712 |
Mexico |
$3,582,862 |
|
Indonesia |
$4,829,684 |
Germany |
$3,699,242 |
Germany |
$3,373,445 |
|
Germany |
$4,757,143 |
United Arab Emirates |
$3,072,537 |
Paraguay |
$2,906,607 |
|
Israel |
$3,883,689 |
Australia |
$2,742,547 |
Australia |
$2,768,219 |
|
Switzerland |
$3,627,216 |
Philippines |
$2,721,300 |
Guatemala |
$2,112,243 |
|
France |
$2,921,289 |
Switzerland |
$2,649,014 |
Philippines |
$1,956,718 |
|
ANNUAL TOTAL |
$66,833,608 |
ANNUAL TOTAL |
$57,495,155 |
ANNUAL TOTAL |
$42,916,000 |
Source: U.S. Census Bureau
Table 4 – Top 10 Foreign Destination Countries (after Canada) for U.S. Shotguns
|
|
2017 |
|
2016 |
|
2015 |
|
United Kingdom |
$410,308 |
Thailand |
$1,270,955 |
United Kingdom |
$3,839,562 |
|
Japan |
$329,168 |
United Kingdom |
$964,791 |
Brazil |
$1,861,141 |
|
Portugal |
$286,674 |
Turkey |
$793,868 |
Turkey |
$1,754,564 |
|
Brazil |
$266,554 |
Germany |
$689,293 |
Thailand |
$1,087,758 |
|
Mexico |
$244,174 |
Mexico |
$641,055 |
France |
$1,060,861 |
|
Thailand |
$237,258 |
Guatemala |
$493,830 |
Italy |
$711,959 |
|
New Zealand |
$233,144 |
Brazil |
$477,064 |
Argentina |
$708,932 |
|
Turkey |
$222,180 |
Italy |
$432,040 |
China |
$547,309 |
|
China |
$164,875 |
France |
$423,410 |
Ukraine |
$544,020 |
|
France |
$138,975 |
Switzerland |
$405,543 |
Guatemala |
$449,785 |
|
ANNUAL TOTAL |
$2,533,310 |
ANNUAL TOTAL |
$6,591,849 |
ANNUAL TOTAL |
$12,565,891 |
Source: U.S. Census Bureau
Table 5 – Top 10 Foreign Destination Countries (after Canada) for U.S. Telescopic Sights for Rifles
|
|
2017 |
|
2016 |
|
2015 |
|
Australia |
$13,547,449 |
New Zealand |
$12,448,133 |
Pakistan |
$40,795,410 |
|
New Zealand |
$7,970,212 |
Australia |
$10,052,078 |
Australia |
$9,769,173 |
|
Netherlands |
$6,983,246 |
Germany |
$6,600,669 |
Germany |
$5,398,028 |
|
Germany |
$5,858,887 |
Jordan |
$6,073,736 |
Sweden |
$3,769,523 |
|
United Kingdom |
$3,941,871 |
Netherlands |
$5,558,483 |
South Africa |
$3,566,724 |
|
Israel |
$3,457779 |
United Kingdom |
$3,273,297 |
United Kingdom |
$3,415,585 |
|
South Africa |
$3,036,730 |
South Africa |
$2,841,737 |
Turkey |
$3,159,001 |
|
France |
$2,207,492 |
Japan |
$2,790,757 |
Indonesia |
$2,850,542 |
|
Japan |
$1,482,336 |
France |
$2,501,325 |
Singapore |
$2,586,052 |
|
Sweden |
$1,476,764 |
Indonesia |
$2,030,964 |
New Zealand |
$2,000,381 |
|
ANNUAL TOTAL |
$49,962,766 |
ANNUAL TOTAL |
$54,171,179 |
ANNUAL TOTAL |
$77,300,419 |
Source: U.S. Census Bureau
Table 6 – Top 10 Destination Countries (after Canada) for U.S. Origin Parts and Accessories
|
|
2017 |
|
2016 |
|
2015 |
|
Australia |
$13,803,662 |
Japan |
$16,785,263 |
Japan |
$31,592,591 |
|
Japan |
$8,281,377 |
Australia |
$14,174,907 |
Australia |
$22,932,097 |
|
Germany |
$7,380,998 |
United Arab Emirates |
$11,570,154 |
Mexico |
$5,034,013 |
|
Mexico |
$7,323,916 |
Mexico |
$7,913,781 |
Iraq |
$4,682,488 |
|
United Kingdom |
$7,057,122 |
Korea, South |
$7,371,253 |
Portugal |
$4,395,666 |
|
United Arab Emirates |
$4,568,407 |
Germany |
$5,526,990 |
Korea, South |
$4,205,341 |
|
Italy |
$3,197,771 |
United Kingdom |
$3,644,515 |
Germany |
$4,063,261 |
|
Portugal |
$3,139,300 |
Netherlands |
$3,336,059 |
Netherlands |
$3,329,650 |
|
France |
$2,963,858 |
Israel |
$3,317,302 |
United Kingdom |
$3,138,539 |
|
Israel |
$2,690,587 |
Italy |
$2,754,938 |
Saudi Arabia |
$2,572,802 |
|
ANNUAL TOTAL |
$60,406,998 |
ANNUAL TOTAL |
$76,395,162 |
ANNUAL TOTAL |
$85,946,448 |
Source: U.S. Census Bureau
Table 7 – Year-to-Year Trends in Exports of Firearms (units exported).
Next Steps?
Identifying the best markets, does not, of course, mean your firearm products export business will succeed. That’s why we will have a few more tips for you in future posts.
Tip No. 2: Develop a Proactive Strategy.